Deep FocusAn atlas of earthquake depths
Where do earthquakes happen, how deep — and what do their depths reveal about plates diving into the mantle?
Summary
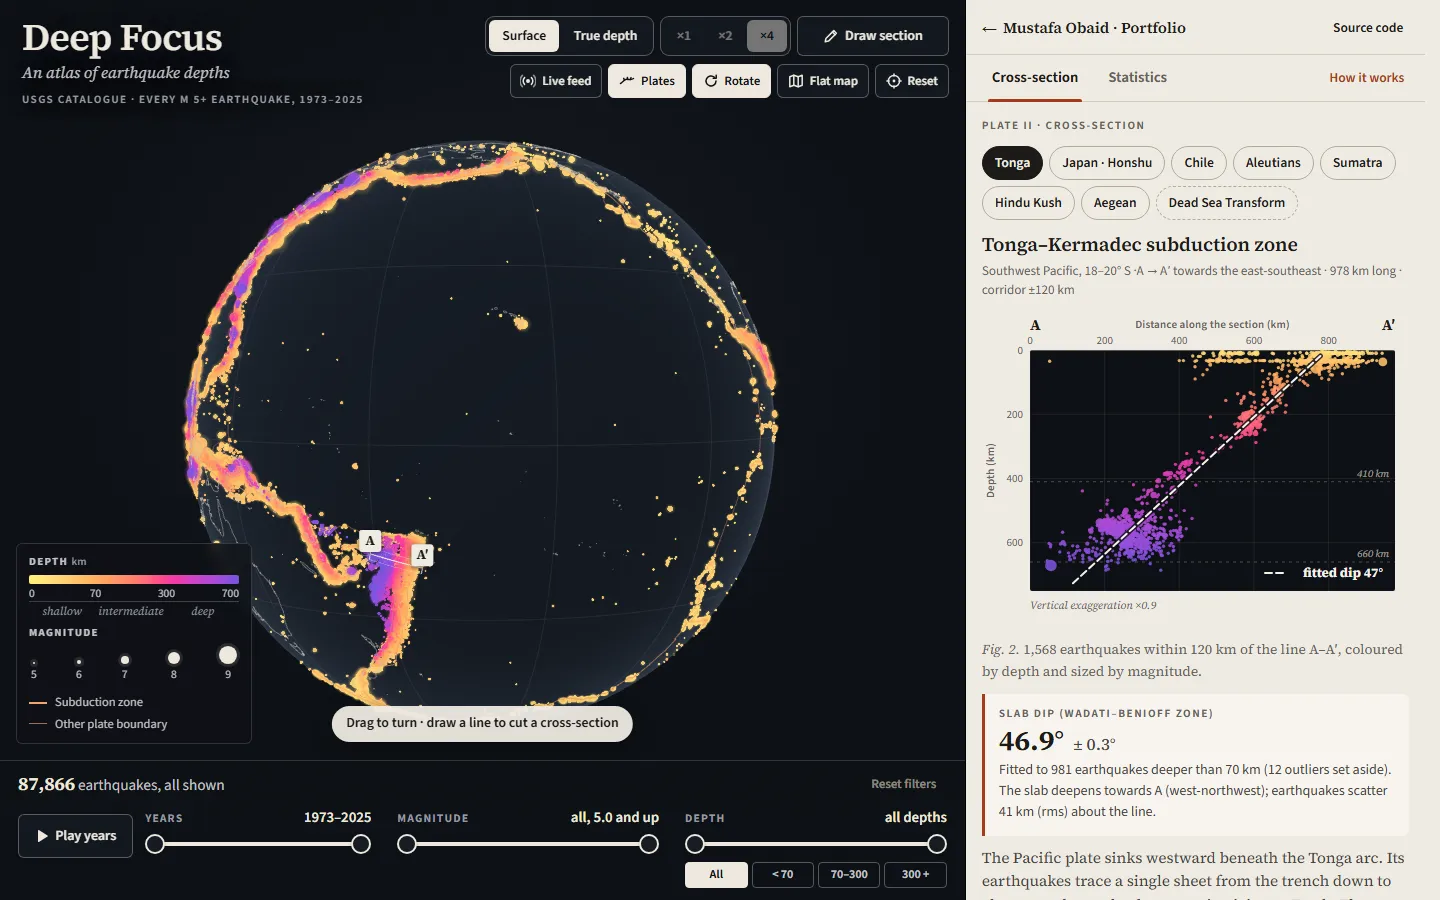
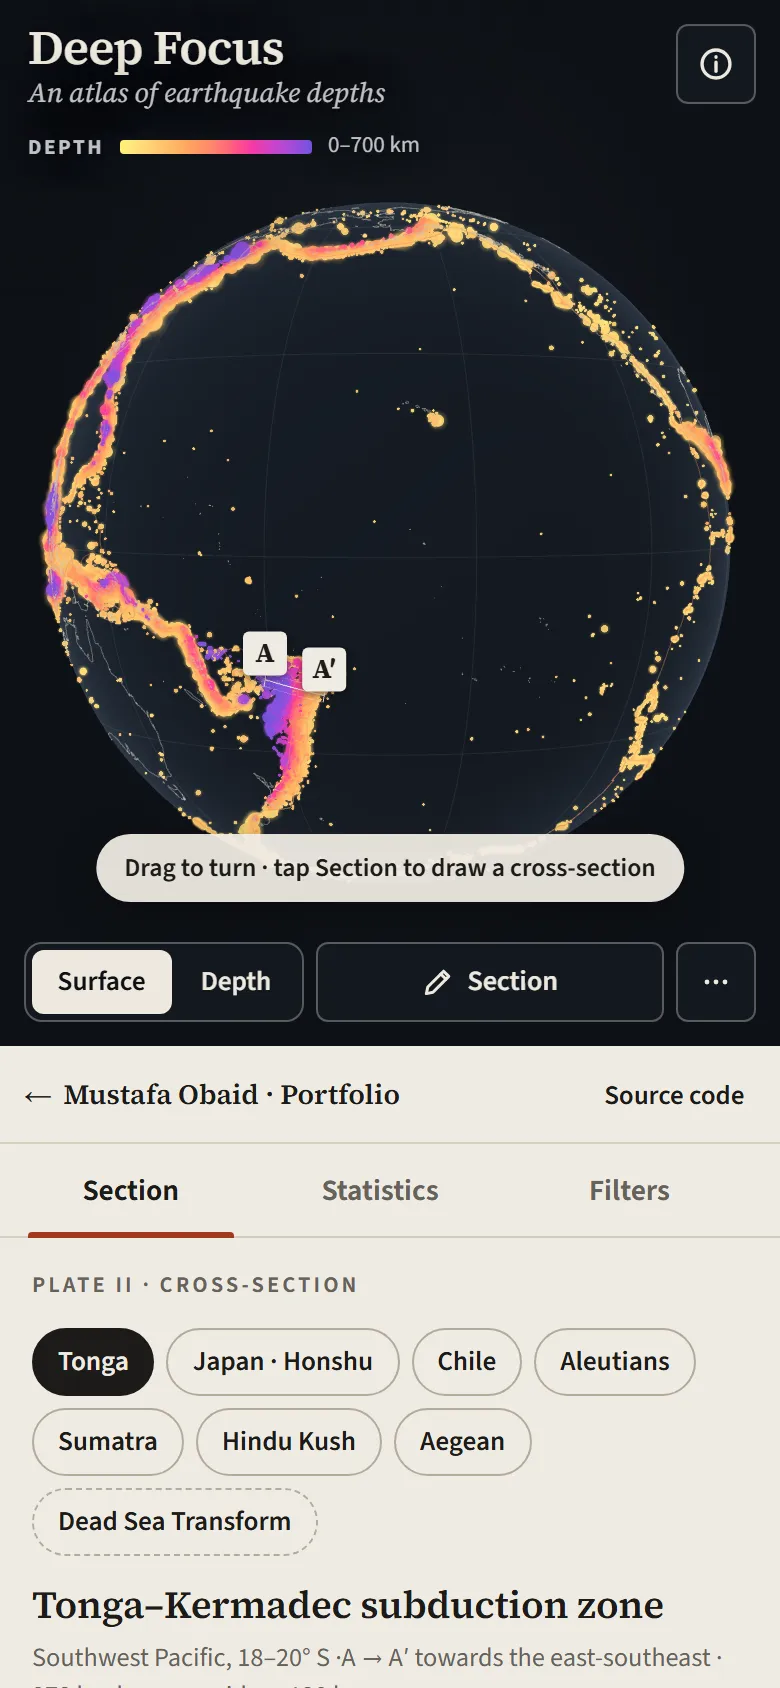
Fifty years of USGS earthquakes on a 3D globe, with cross-sections that reveal subducting slabs and statistics for any region you select.
What you can do
- 87 866 earthquakes (M ≥ 5, 1973–2025) on a 3D globe, coloured by depth.
- True-depth mode sinks every event inside a translucent Earth so subducting slabs appear.
- Cut a cross-section anywhere, or pick one of eight presets, and get the fitted slab dip with its uncertainty.
- Gutenberg–Richter statistics with the b-value for any selection, depth histograms and events per year.
- A live layer of the last month from USGS, a flat-map view and full keyboard control.
How it works
A reproducible script downloads the USGS ComCat catalogue year by year and packs it into compact binary files that a Web Worker decodes. three.js draws the globe, cross-sections project events onto a great-circle profile, and the b-value uses the Aki/Utsu maximum-likelihood estimator with Shi & Bolt uncertainty.
The hard part
Turning fifty years of raw catalogue data into a fast, honest 3D instrument: about 1.5 MB of data, tens of thousands of points at interactive frame rates, and statistics that hold up on synthetic tests.
Validation
- Yearly counts vs the USGS count endpoint
- 53 / 53 years match
- b-value on synthetic catalogues (0.8 / 1.0 / 1.2)
- mean 0.799 / 0.995 / 1.191
- Slab-dip fit on synthetic slabs, 20–85°
- mean error ≤ 0.7°
- Reference events (Tōhoku, Bolivia 631 km, Okhotsk 598 km)
- present and matching
- Tonga slab dip, real catalogue
- 46.9° ± 0.3°